I’ve spent 25 years in information security. Long enough to see SIEM rise from the old audit requirements of “aggregated, network based logging”, with the birth of the “correlation” buzzword, and with its fall seen the rise of the “normalisaton” buzzword. I’ve built SOCs, tuned them, fought alert noise, and tried to control the spiralling cost that comes with doing security badly at scale.
And through all of that, one principle has never changed.
Know your environment. Know your security strategy. Understand your threat model. Build a picture of normal. Alert on what is truly abnormal—and truly risky.
The Sacred Cows of the SOC
If you follow the above-described approach, something interesting happens. A number of “must-haves” in modern SOC conversations start to look… negotiable:
SOAR is not always mandatory
Threat hunting is cool
More analysts does not equal better outcomes
Expensive threat intelligence feeds are mandatory
These are not heretical views—they’re just uncomfortable ones. Because they challenge a model where complexity and cost are often mistaken for maturity.
In reality, a well-understood environment with sharply defined risk tolerance will outperform a bloated SOC every time.
Enter AI: The New Buzzword Cycle
Now we have a new layer: AI, and if you read the current wave of content, you’ll notice a pattern. The most confident “AI success stories” tend to avoid talking about SIEM at all!
Instead, we get familiar phrases:
“Enriching data feeds”
“Augmenting analysts”
Let’s pause on one of those.
“Enrichment” of Data
“Enrichment” has quietly joined the long list of SIEM buzzwords. But what does it actually mean? Better data? According to whom? Data quality is not universal. It is entirely dependent on your environment, your systems, and your risks. An event that is critical in one organisation is meaningless in another.
You can train an AI model to process data. But can you teach it what matters in a specific, messy, evolving environment? That’s not just a data problem. That’s a context problem.
The Analyst Productivity Argument
Another popular claim:
“AI won’t replace analysts, but it will make them more productive.”
It sounds reasonable. It’s also mostly unproven in the SIEM context. Take “noise reduction”—a classic SOC problem. Who defines noise?
That decision requires:
Knowledge of the environment
Understanding of business risk
Familiarity with attacker behaviour
That’s not magic. But it does require experience and judgement. Can an AI learn this? Possibly, in constrained scenarios. Can it generalise this across real-world environments without introducing blind spots? That’s much harder to believe.
The Missing Layer: Technical Depth
What’s consistently absent from “AI transformed my SOC” narratives is technical depth.
Where are the discussions about?:
Operating systems
Network behaviour
Application logic
Even in fully SaaS environments, you are still dealing with operating systems, identity layers, protocols, and execution paths.
Can AI Fix a Broken SOC?
AI can easily flog a dead horse that is a cost-sinkhole SOC (plenty of those around on all continents – it needs a collective noun), but can it get a SOC to rise phoenix-like from the ashes of its dark history? That is as close to a ‘no’ as you’re ever going to get without it actually being a ‘no’.
I remain open minded, but i want to see technically grounded discussions in order to change that position. The SIEM community has long conversations for the long nights of winter e.g. “do i want to use sysmon if i have a CIS benchmark compliant Audit Policy service?”. This is the level that the conversation has to be, at, without perhaps the same volume.
AI can absolutely make those SOCs more efficient at being inefficient. can it transform a fundamentally flawed SOC into an effective one? That’s very close to a “no.” Not because AI is weak—but because the problem is structural.
If you don’t understand your environment, your risk, and your attack surface, no amount of automation will fix that.
The Hard Problem: Teaching an Attack Mindset
At its core, effective detection relies on an attack mindset.
That comes from:
Understanding how systems really behave
Knowing how they break
Seeing how attackers chain small weaknesses into real impact
We’ve seen early attempts to automate parts of this—especially in areas like network path analysis and automated penetration testing.
But anyone who has participated in real-world red teaming or unrestricted penetration testing knows the truth: This is not a linear process. It involves intuition, creativity, and adapting to incomplete information. Teaching that to an AI agent is not impossible—but it is a very hard problem.
Final Thought
I’m not anti-AI. Far from it. But I am sceptical of narratives that skip over the hard parts.
Can AI replace the fundamentals?:
Understanding your environment
Defining risk properly
Thinking like an attacker
Until AI can operate meaningfully at that level, it remains a tool, of sorts, hopefullly not a very expensive tool.
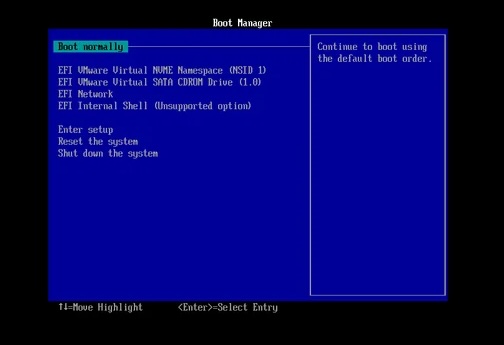
I recently encountered a situation where my Ubuntu 24.04 VM was failing to boot. The blue screen DOS-style Boot Manager would be displayed and booting was halted here, with an implicit ‘you shall not pass’. This post covers how i addressed the problem,
Here is my setup:
Apple MBP M4
VMware Fusion 13.6.3
VM – Ubuntu 24.04 Server ARM
Maybe this article is not for you – here’s a quick summary to help you decide for yourself; create an Ubuntu ARM Server (Server was the only ARM version in Ubuntu town) bootable disk, attach the USB drive to the VM, boot from the USB drive, break out of the Ubuntu Server install and drop to a shell (this was not straightforward – see below), mount the correct /dev devices on /mnt and /mnt/boot/efi, along with dev, proc, etc directories. From here there’s one or both of two deviants who are liikely guilty – GRUB corruption, or kernel corruption. In my case it was GRUB corruption and the fix is below…
The Bootable Disk
This was a very helpful article: Create a bootable USB stick on Ubuntu – this should have got you all the way to a bootable USB drive. The iso to use is of course the ARM server version if you on M1-4 Mac. At the time of writing there is no Ubuntu Desktop 24 for ARM architectures.
Connecting Your USB Drive To Your VM
Having followed the link Create a bootable USB stick on Ubuntu , you will have got your MBP to recognise the USB drive. Boot your VM. You may not see the USB as a selectiable boot drive in the top menu, in which go down to ‘Reset The System’. This worked for me. Boot from the USB drive.
Ubuntu ARM Server install Breakout
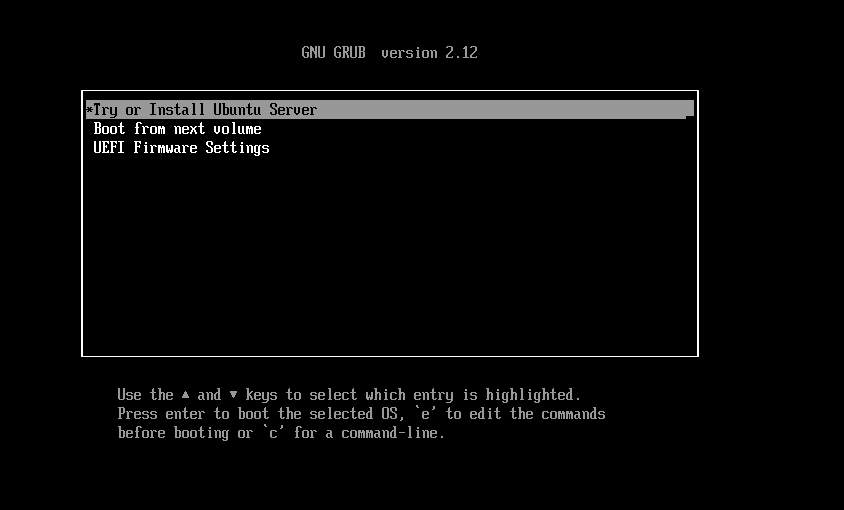
You should see the following Grub screen …
There is an option there – ‘Try or Install Ubuntu Server’. The menu is lying to you – do not believe it. There is no ‘try’, there is only install. Unless you find an off-script way to break out. Hit enter for the try/install option and then select the help option in the top right (as below), within which menu there is a shell option …
Mounting Your Ubuntu Drive and Repairing Your GRUB
Entering the shell, you are in a world where you are running a shell of the OS from the USB drive. You are not yet on the planet you want to be on, which is your broken Ubuntu 24 partition.
List your devices
From the shell prompt use the command:
lsblk
This will list the filesystems by device. One of them will be your boot partition, another will be the device that holds your broken VM’s root filesystem. In my case the 2 partitions of interest were /dev/nvme0n1p1 and /dev/nvme0n1p2, the latter of which is my root partition.
Mount these two partitions
mount /dev/nvme0n1p1 /mnt
mount /dev/nvme0n1p2 /mnt/boot/efi
You should see your famiiliar old files and directories under /etc and /home.
Mount the necessary system directories:
for i in proc dev sys; do mount --bind /$i /mnt/$i; done
Chroot into your not-booting VM:
chroot /mnt
Post-chroot Diagnostic Steps
Re-install the kernel…
apt update
apt install --reinstall linux-image-generic
Check the contents of the EFI folder:
ls /mnt/boot/efi
You should see something like this:
EFI/
└── ubuntu/
├── grubaa64.efi
└── grub.cfg
If the directory is empty, you need a GRUB fix…
Hopefully you don’t need to reinstall GRUB. This should be enough:
Anyway – here’s a few cheeky scripts for testing a handful (for now) of aspects of the CIS Benchmarks 2.0 for Azure. You have to populate the subscriptions.txt file for each.
Each subdirectory under the repository root corrresponds with a CIS Benchmark reference for Azure 2.0:
1.4, 1.5 – Review Guest Users – script list the Guest users configured in Entra
1.23 – Ensure That No Custom Subscription Administrator Roles Exist
3.1 – Ensure that ‘Secure transfer required’ is set to ‘Enabled’ [Storage Accounts]
3.2 – Ensure that ‘Enable Infrastructure Encryption’ for Each Storage Account in Azure Storage is Set to ‘enabled’
3.7 – Ensure that ‘Public access level’ is disabled for storage accounts with blob containers
3.10 – Ensure Private Endpoints are used to access Storage Accounts
3.11 – Ensure Soft Delete is Enabled for Azure Containers and Blob Storage
3.12 – Ensure Storage for Critical Data are Encrypted with Customer Managed Keys
3.15 – Ensure the “Minimum TLS version” for storage accounts is set to “Version 1.2”
5.1.3 – Ensure the Storage Container Storing the Activity Logs is not Publicly Accessible
5.1.6 – Ensure that Network Security Group Flow logs are captured and sent to Log Analytics
6.5 – Ensure that Network Security Group Flow Log retention period is ‘greater than 90 days’
6.7 – Ensure that Public IP addresses are Evaluated on a Periodic Basis (lists the addresses)
7.4 – Ensure that ‘Unattached disks’ are encrypted with ‘Customer Managed Key’ (CMK) (lists unattached disks)
8.2 – Ensure that the Expiration Date is set for all Keys in Non-RBAC Key Vaults (usually all key vaults will be RBAC enabled, making this control non-applicable. One script lists the RBAC and non-RBAC Key Vaults, then there’s an untested script for listing the non-expiring keys)
8.3 – Ensure that the Expiration Date is set for all Secrets in RBAC Key Vaults. The script is untested because of a lack of access to a test key vault(s).
8.4 – Ensure that the Expiration Date is set for all Secrets in Non-RBAC Key Vaults (usually all key vaults will be RBAC enabled, making this control non-applicable. One script lists the RBAC and non-RBAC Key Vaults, then there’s an untested script for listing the non-expiring secrets)
10.1 – Ensure that Resource Locks are set for Mission-Critical Azure Resources
Some of the cli scripts offered by CIS in their Azure benchmark don’t work – Azure changes faster than the benchmarks after all. The above were tried and tested in a real live environment (no, those are not the subscription IDs listed in the subscriptions.txt files!!). 5.1.6 is an example. The ‘nsg’ parameter was made obsolete. Technically the script will run with a warning if the ‘nsg’ parameter is used, but anyway I have done as suggested and used the ‘–location and –name combination’ in the az network watcher command instead.
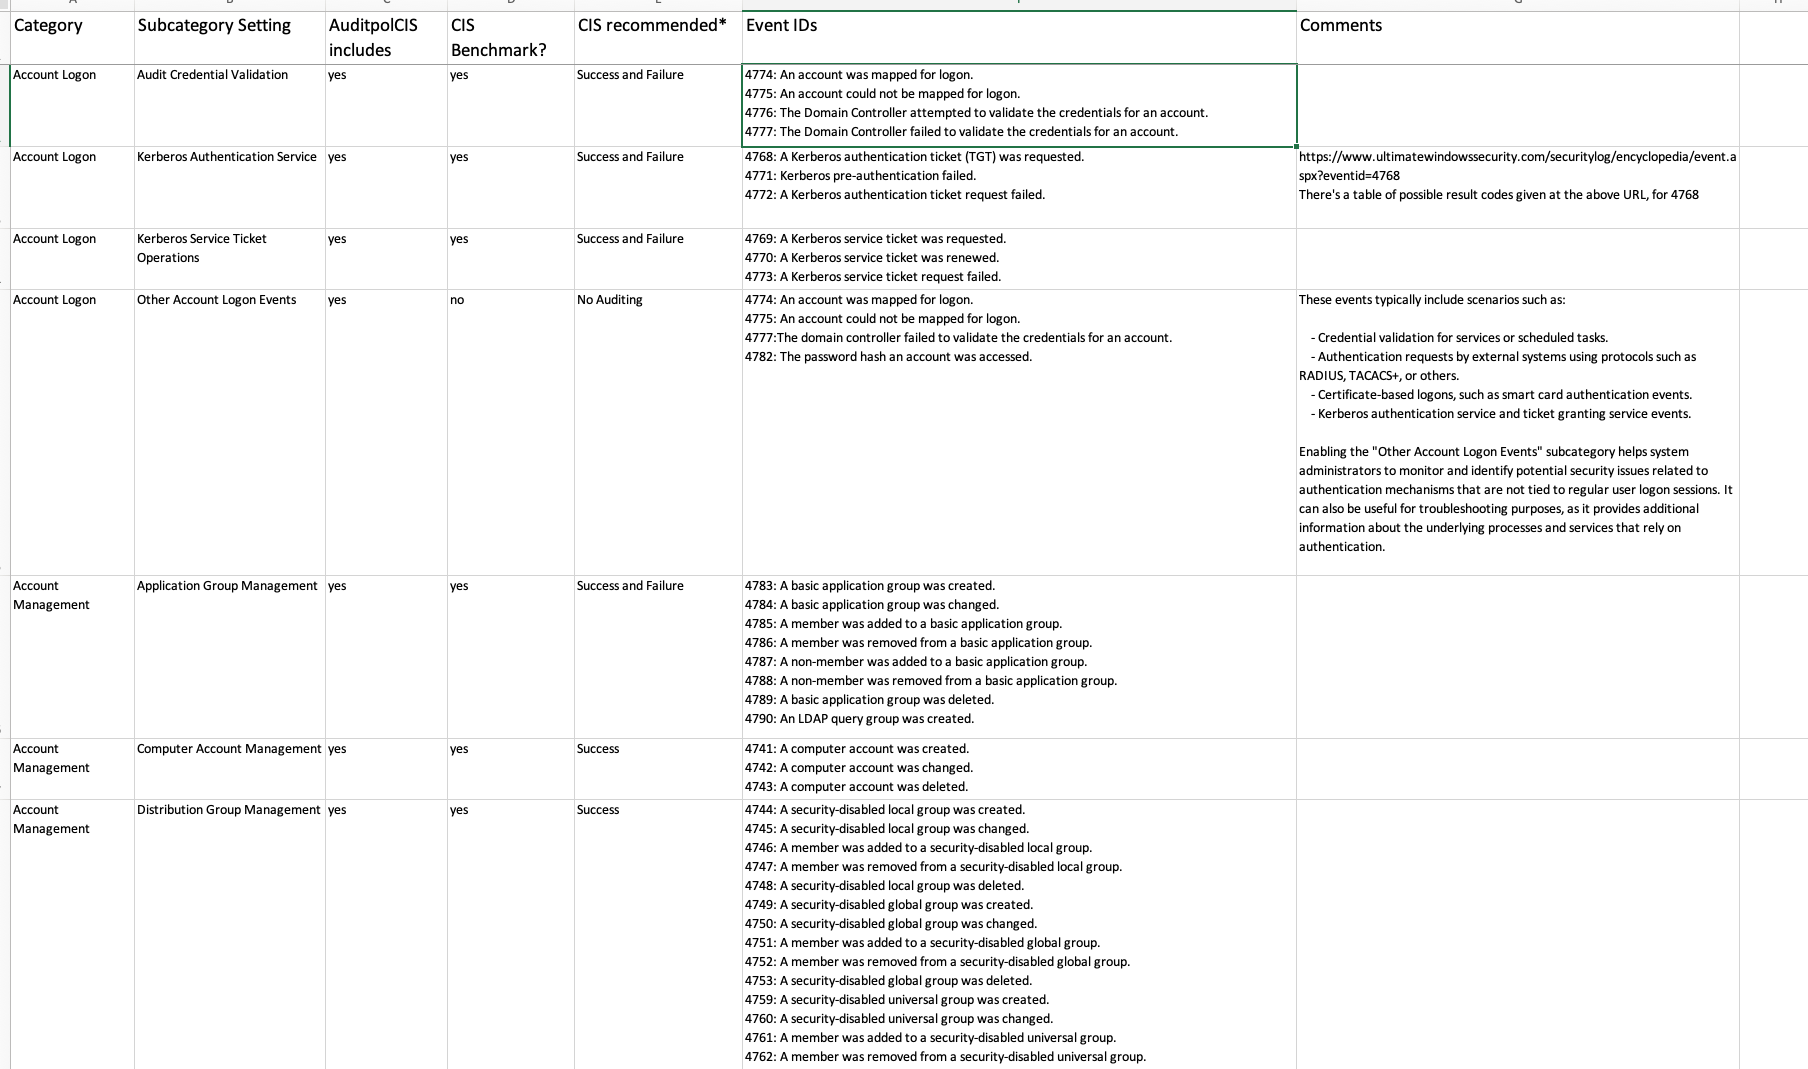
In the previous post on the subject of Windows SIEM, we covered the CIS benchmarks for Windows Auditing Policy in a spreadsheet, which was provided freely (really, actually free).
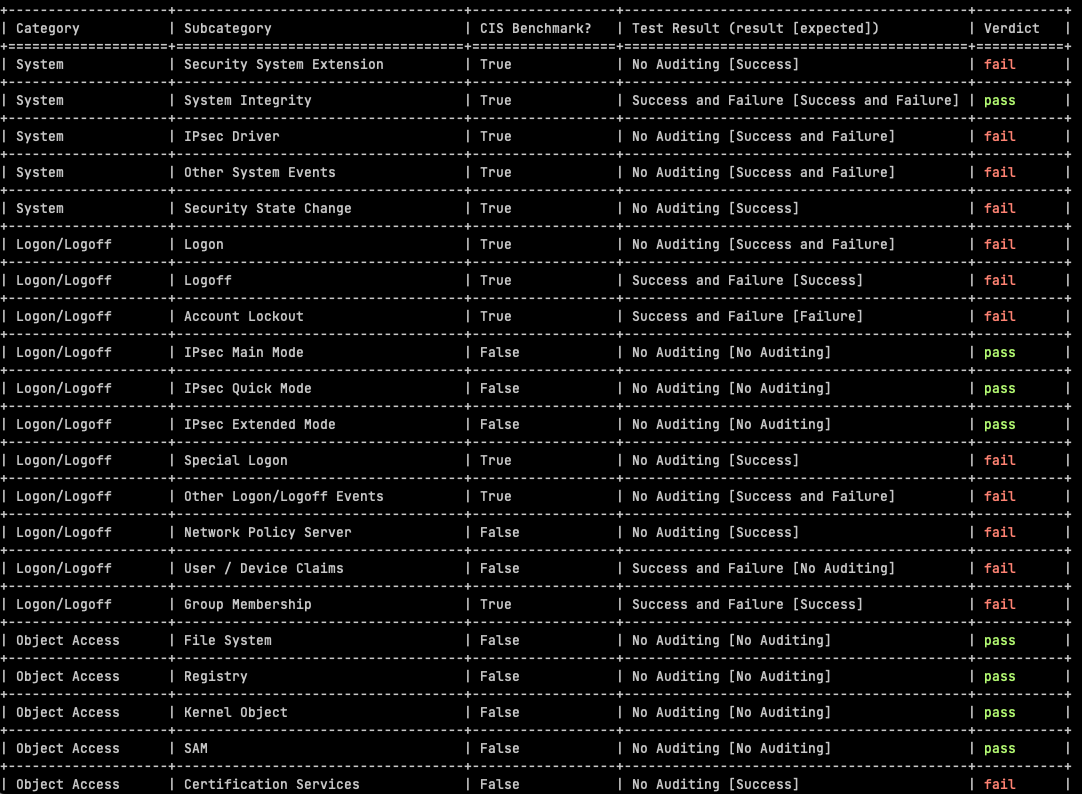
This week we introduce a python open source tool we have developed, to automate the CIS Benchmark testing.
The automated assessment results from AuditpolCIS, as it’s based on CIS Benchmarks, helps in the support of meeting audit requirements for a number of programs, not least PCI-DSS:
Audit account logon events: Helps in monitoring and logging all attempts to authenticate user credentials (PCI-DSS Requirement 10.2.4).
Audit object access: Monitors access to objects like files, folders, and registry keys that store cardholder data (PCI-DSS Requirement 10.2.1).
Audit privilege use: Logs any event where a user exercises a user right or privilege (PCI-DSS Requirement 10.2.2).
Local log files sizes and retention policies are useful in assessing compliance with e.g. 5.3.4 and 10.5.1 requirements (PCI-DSS 4). There should be a block of text after the audit policy results.
Usage / Setup
First you will to set up a Python Virtual Environment. Ensure that you have Python installed on your system (Python 3.10 was used in development). If not, download and install Python from the official website: https://www.python.org/downloads/
Open a Command Prompt or terminal window and navigate to the folder where you extracted the AuditpolCIS project.
Run the following command to create a new virtual environment:
python -m venv venv
Activate the virtual environment by running:
For Windows:
venv\Scripts\activate
For macOS/Linux:
source venv/bin/activate
Install the required Python packages from the requirements.txt file by running:
pip install -r requirements.txt
You will need a .env file in your project root. The contents relate to the target you wish to test:
HOSTNAME='<Windows box IP address or host name>'
USERNAME='<Windows user account name>'
PASSWORD='<account password>'
Make sure to assign the right ownership and permission on .env. Usually the permissions will be 600.
Once the virtualenv is enabled, you can run the code:
The CIS benchmarks are based on Windows 2019 Server but they apply to other target varients on a Windows theme. I know none of you will have EOL Windows versions. <Sarcasm engaged>I mean in 22 years of consulting, i’ve never seen any out-of-support warez in critical business usage</Sarcasm engaged>.
Powershell is not required on the target but use of Powershell is also not a crime. Yes, that was a security person who said that.
Sustainability / Use of Regex
I had to use some fairly snazzy regex to pull out Categories (category_pattern = r'^(\w+.*?)(\r)?$') and Subcategories (subcategory_pattern = r'^( {2})([^ ]+.*?)(?=\s{3,})(.*\S)') from the auditpol command output. I did look at more sustainable ways of achieving the same goal, although admittedly i didn’t spend much time doing that. One thing has been clear for a long time with Windows – don’t go looking for registry keys because that can be very painful. Not only is documentation for a key location somewhat thin and erroneous, the key loation also often changes across Windows versions. ChatGPT‘s lack of knowledge of Windows reg keys bears testimony to the previous comments.
So there are two sources of Subcategory names – there is cis-benchmarks.yaml and there is the output of the auditpol /get /category:* command. If there are entries in the YAML file which are not in the auditpol output, they are flagged in the script output, and the same is true vice versa. So if you make spelling mistakes in the excel sheet or YAML file, it will be flagged. It can also happen that auditpol output subcategories do not reflect the CIS Benchmarks subcategories, perhaps with different Windows versions as targets. Any of these categories will be flagged by the script and listed below the pass/fail results.
If you want to change the verdicts or [Sub]Category names, you are of course free to do so. You can edit the cis-benchmarks.yaml file, or edit the included spreadsheet, followed by running the included genyaml.py.
I know use of AutoAddPolicy with Paramiko in Python is not good form, but also assume that as an admin in the position of someone who performs daily tasks using administrative rights, that you know your hosts. Sometimes security people do get in the way of progress, when there’s low risk issues afoot. Use of RejectPolicy instead of auto-add would be one such case.
Tests Rationalisation
Some of the tests included are not a CIS Benchmark (out of 59 tests, 32 are CIS Benchmarks, whereas 27 are not). It’s not clear why the subcategories were omitted by CIS but anyway – in these cases we have made an assessment based on logging events volume for this subcategory, versus the security value of the subcategory. Most of these are just noise, and in many cases, very high volume noise, so we have advised “No Auditing”.
Customising Test Criteria
The testing template is formed of the YAML file cis-benchmarks.yaml. If you prefer to make changes to the testing template with Excel, the sheet is CIS-Audit-Reqs-Windows2019Server.xlsxin the code root. You can then use the python script genyaml.py to generate a new YAML file (you will need to use the right virtualenv, see above for usage instructions).
In our 2021 blog post, we focused on identifying quick wins for optimizing Windows Events, and provided a free spreadsheet (really free, not even a regwall) that indicated Windows Events that could be safely ignored, some of which cost lots for SIEM engines to ingest. This post takes a broader Windows Audit Policy view, and offers another free resource – this time taking a broader look in the context of comparing your setup for Windows Audit Policy, and the venerable CIS Benchmark for Windows 2019 Server.
If there’s sufficient interest i’ll follow up with a development effort for a Python tool (also freely available, on Github) that connects to your Windows server and performs the CIS Benchmark assessment as indicated in the spreadsheet.
SIEM Nightmares
Based on many first hand observations and second hand accounts, it’s not a stretch to say that many organisations are suffering from SIEM configuration issues, for which the result is a low signal-to-noise ratio. Your SIEM is ingesting lots of events, many of which are not at all helpful, and with most vendors charging by volume, it gets expensive. At the same time, the false negative problem is all too common. Forensics investigations reveal all too often that there are no events recorded by the expensive SIEM, that even closely relate to the incident. I hope you are never in this scenario. The short-term impact is never good.
Taking SIEM as a capability, if one is to advise on how to improve things, it is rarely ever about the technology. When one asks Analysts (and based on job postings, also hiring managers) about SIEM, it’s clear the first thing that comes to mind is Splunk. ELK, Sentinel, etc. I would estimate the technology-only focus with SIEM to be the norm rather than the exception, and it comes hand-in-hand with a failure to detect privilege elevations, and lateral movements for example.
There are some advisories that we can give out that are independent of your architecture, but many questions about SIEM configuration can only be answered by you, using your knowledge of the IT landscape in your organisation. The advisories in the referenced spreadsheet cover the “noise” part of the signal-to-noise ratio. These are events that are sure to be noise to at least a 90% level of assurance, from a security perspective.
Addtional Context on the Spreadsheet
Some context around the spreadsheet: where there is a CIS Benchmark metric for a specific Audit Subcategory, the spreadsheet follows exactly the CIS recommended setting. But there are some (e.g. DS Access –> Directory Service Access) where this subcategory was not covered by CIS. In these cases, an assessment is made based on our real-experience observations of logging volumes, versus the security (not the IT diagnostic, or other value) value of Audit Subcategories. In this case of the Directory Service Access subcategory, it can be turned off from a security perspective.
There is limited information available regarding actual experiences with specific event ID volumes. In 2018, I had the opportunity to track Windows events in a Splunk architecture for a government department. During this time, I recorded the occurrences of events over a 24-hour period on a network of approximately 150 Windows servers of various versions, some of which were quite exotic. This information has been valuable in supporting decisions related to whether or not to disable auditing.
SIEM Forwarder Filtering
There is another option offered by some SIEM vendors and that is to filter events by Event ID. Overall, the more resource-friendly approach is to prevent the events being generated at source, but in many cases this may not be feasible. Splunk for example allows you to filter at forwarders (via the inputs.conf file on the Splunk forwarder. This file is usually located in the $SPLUNK_HOME/etc/system/local/ directory … more info – BTW it looks like Splunk agrees with us on the 4662 event mentioned as an example above. Yay!).
Credits and Disclaimers
Windows Events are sometimes tricky to understand, both with respect of what the developers intended with those events, and the conditions under which they are generated. Sometimes with Windows Events, we are completely in unknown territory, even if there is some Microsoft documentation that covers them. Here’s one example from Microsoft documentation to fill us with confidence – “This auditing subcategory should not have any events in it, but for some reason Success auditing will enable the generation of event 4985″.
Ultimately only you can decide what’s best for the health of your SOC/SIEM. Only you know your network and your applications. The document supplied here was only intended as a guide, and to aid decision making. It was not intended to make decisions for you.
The cybersecurity landscape often focuses on the more sensational aspects, such as high-profile hacks or fake influencers, which can overshadow the essential work done by countless professionals in the background. These unsung heroes are dedicated to ensuring the stability and security of our digital infrastructure, and their contributions should not be underestimated. Among those are tthe likes of Randy Franklin Smith (founder of Ultmate Windows Security) who has put together an “encyclopedia” of Windows Event IDs. The experiences shared there were used in-part to form a view on whether or not to reject or accept certain Windows Events.
Before i continue, it’s pertinent to gives a heads up: nothing in this article relates to ChatGPT. Sorry.
Lots of fuss was abound this morning (on the back of articles from yesterday with attention-grabbing headlines) regarding these 2 vulnerabilties disclosed, reported as CVE-2023-20078 and CVE-2023-20079. The first of these is rated 9.8 under CVSS 3.1!! (Oh no).
A few points:
Affected products: Cisco IP Phone 6800, 7800, 7900, and 8800 Series.
The first vulnerability (CVE-2023-20078) is given as an RCE with instant-root, with the web-based management interface of the phone. The other is noted as a DoS condition.
Whereas the aforementioned sounds bad, do you have your phones facing the Internet with a public IPv4 address? Probably not. So the attacker would need an internal presence to exploit this condition. If they have an internal presence, are they really going to be going after your phones? They might one supposes. Only you can answer this question.
The CVSS rating of 9.8. About that. Lots of stuff is rated 10. Lots of stuff that shouldn’t be. It’s a long story but CVSS ratings have been slammed multiple times by multiple esteemed analysts over the past 5 years. This case here is interesting because we’re talking about phones… the 2nd vulnerability covered is given a 7.8 rating, primarily because its ONLY a DoS . But with YOUR organisation, maybe DoS on your phones is worse than a remote take-over of the phones. CVSS ratings are not based on YOUR network. The folks who put together these ratings know nothing about YOUR organisation. You have to figure out your own risks based on threat modelling (I prefer the OWASP metholodogy).
The potential for an automated attack is also there.
At the time of writing there was no publicity about attacks in the wild or public disclosed exploit code.
Cisco has released software updates that address these vulnerabilities.
The RCE as root might get some attention. Usually this is bad development or sys admin practice – to have processes running with super user privileges unnecessarily. However in this case the phone management software is management software and as such needs to manage – it needs root privileges. Let’s not bash Cisco over this one.
Finally – a blast from the past. What does Cisco have against web interfaces? A bug I remember that was useful in pen tests, primarily for learning about the target network, involved being able to pass commands under Level 15 (the highest) privileges with no authentication. The advice from Cisco was really something like ‘don’t use HTTP – disable it’.
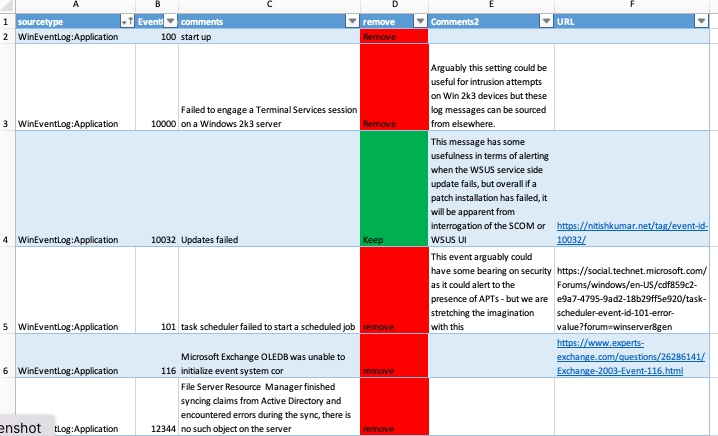
There has been a modicum of interest in a Windows spreadsheet I shared on social media recently, that if absorbed and acted upon, can be a early no-brainer win with SIEM products that are licensed based on volume or Events Per Second (EPS).
Its no big secret that Windows machines, virtual or real, are noisy. Clients I worked with – I would estimate 90%, for various reasonsdon’t act on the noise from Windows devices and it’s costing them a fortune (right or wrong, approx 50% of those prioritise other tasks).
In Splunk, one can use searches to estimate the benefit of removing noisy Windows events, and what I found was quite a broad range of results. It makes little sense to give the full breakdown because the result depends heavily on the spread and amount of Windows to other Operating Systems (OS). But there were a couple of cases where logging events volume was reduced by 70%.
Some points to note:
If the “remove” events are removed, Windows devices become very quiet. Some organisations use events as an indicator of “alive” rather than using active host monitoring. So with this logging configuration, an alternative (more sensible) host monitoring method is needed.
Removing these events is highly unlikely to ever result in a failure to detect an attack, but being 100% certain of this is impossible.
The most critical aspect of logging isn’t related to these events at all, its about your custom use cases. An example: a usual scenario is for a database listening service to accept application level connections on its listening service port (e.g. 1521 TCP is default for Oracle DB), and the source will be a web or middleware tier. So – configure an alert for when connections come from a source other than the middleware/application tier.
Very little actual analysis of Windows events and their purpose is known, or if it is known it is certainly not shared anywhere. There are some historical aspects to many of these events in that they’ve been around for more than 20 years but were never documented particualrly well, apart from here. I have added some insight but not for all events. Hence: if anyone would like any of the contents added or edited, feel free to comment below.
The context here is security. For other logging use cases, other events may need to be switched on.
The major versions of MS Windows Server that this journal applies to are: 2003, 2008, 2012. Many will apply to both 2016 and 2019.
So here are the links.. note there is no reg or pay wall. You will not be tracked and no data will be held about you. This is a completely free resource for you to collect anonymously:
It’s clear from social media and first hand reports, that the awareness of what VA (Vulnerability Assessment) scanners are really doing in testing scenarios is quite low. So I setup up a test box with Ubuntu 18 and exposed some services which are well known to the hacker community and also still popular in production business use cases: Secure Shell (SSH) and an Apache web service.
This post isn’t an attack on VA products at all. It’s aimed at setting a more healthy expectation, and I will cover a test scenario with a packet sniffer (Wireshark), Nessus Professional, and OpenVAS, that illustrates the point.
I became aware 20 years ago, from validating VA scanner output, that a lot of what VA scanners barf out is alarmist (red flags, CRITICAL [fix NOW!]) and also based purely on guesswork – when the scanner “sees” a service, it grabs a service banner (e.g. “OpenSSH 7.6p1 Ubuntu 4ubuntu0.3”), looks in its database for public disclosed vulnerability with that version, and flags vulnerability if there are any associated CVEs. Contrary to popular belief, there is no actual interaction in the way of further investigating or validating vulnerability. All vulnerability reporting is based on the service banner. So if i change my banner to “hi OpenVAS”, nothing will be reported. And in security, we like to advise hiding product names and versions – this helps with drive-by style automated attacks, in a much more effective way than for example, changing default service ports.
This article then demonstrates the VA scanner behaviour described above and covers developments over the past 20 years (did things improve?) with the two most commonly found scanners: Nessus and OpenVAS, which even if are not used directly, are used indirectly (vendors in this space do not recreate the wheel, they take existing IP – all legal I’m sure – and create their own UI for it). It was fairly well-known that Nessus was the basis of most commercial VAs in the 00s, and it seems unlikely that scenario has changed a great deal.
Test Setup
So if I look at my test box setup I see from port scan results (nmap):
PORT STATE SERVICE VERSION
22/tcp open ssh OpenSSH 7.6p1 Ubuntu 4ubuntu0.3 (Ubuntu Linux; protocol 2.0)
25/tcp open smtp Postfix smtpd
80/tcp open http Apache httpd 2.4.29 ((Ubuntu))
139/tcp open netbios-ssn Samba smbd 3.X - 4.X (workgroup: WORKGROUP)
445/tcp open netbios-ssn Samba smbd 3.X - 4.X (workgroup: WORKGROUP)
3000/tcp open http Apache httpd 2.4.29 ((Ubuntu))
5000/tcp open http Docker Registry (API: 2.0)
8000/tcp open http Apache httpd 2.4.29
So…naughty, naughty. Apache is not so old but still I’d expect to see some CVEs flagged, and I can say the same for the SSH service. Samba is there too in a default format. Samba is Linux’s implementation of MS Windows SMB (Server Message Block) and is full of holes. The Postfix mail service is also quite old, and there’s a Docker API exposed! All this would get an attacker quite excited, and indeed there’s plenty of automated attack scenarios which would work here.
There was also an EOLPhpmyadmin and EOL jQuery wrapped up in the web service.
Developments in Two Decades
So there has been some changes. For want of a better word, there’s now more honesty. In the case of OpenVAS, for vulnerability that involves grabbing a banner and assuming vulnerability based on this, there is a Quality of Detection (QoD) rating, which is set as default at around 70%. This is a kind of probability rating for a finding not being a false positive. Interestingly those findings that involve a banner grab are way down there under 50, and most are no longer flagged as “critical”.
Nessus, for its banner-grabbed vulnerabilities, is more explicit and it is report will state “Note that Nessus has not tested for this issue but has instead relied only on the application’s self-reported version number.”
Even 7 years ago, there would be lots of issues reported for an outdated Apache or SSH service, many of which would be flagged wrongly as CRITICAL, but not necessarily exploitable, and the existance of the vulnerability was based only on a text banner. So these more recent VA versions are an improvement, but its clear the awareness out there of these issues is still quite low. The problem is now – we do want to see if services are downlevel, so please $VENDOR, don’t hide them (more on this later).
First Scan – Banners On Display
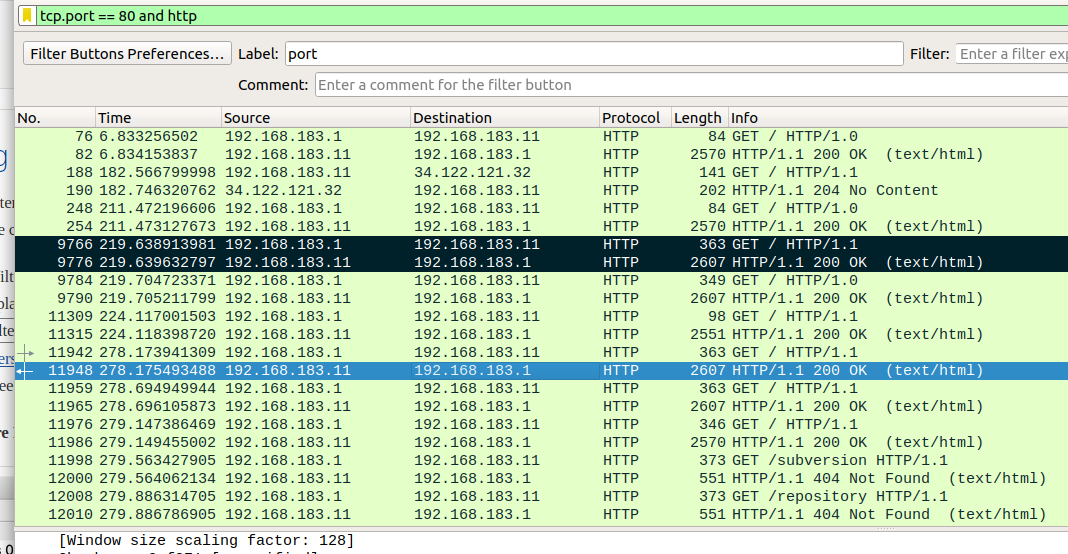
So using Wireshark, sniffing HTTP on port 80 (plain text) we have the following…
Wireshark window showing the OpenVAS interaction with the text box target
The packets highlighted in black are the only two of any interest, wherein OpenVAS has used the HTTP GET method to request for “/”, and receives a response where the header shows the product (Apache) and version (2.4.29).
Note the Wireshark filter used (tcp.port == 80 and http). Other than the initial exchange where a banner was grabbed, there was no further interaction. This was the same for Nessus.
What was reported? Well, for OpenVAS, a handful of potential CVEs were reported but I had to lower the QoD to see them! Which is interesting. If anything this is moving the bar too far in the opposite direction. I mean as an owner of this system, I do want to know if i am running old warez!
For Nessus, 6 Apache CVEs were reported with either critical or “high” severity. Overall, I had a similar experience with that of OpenVAS except to even see the Apache issues reported I had to beg the scanner with the following scan configuration setup:
Settings –> Assessment –> Override normal accuracy and show potential false alarms
Settings –> Assessment –> perform thorough tests
Settings –> Advanced –> enable safe checks on (and i also tried the “off” option)
Settings –> Advanced –> plugins –> web servers –> enabled. This is the Apache vulnerability section
For the SSH service, OpenVAS reported 3 medium issues which is roughly what i was expecting. Nessus did not report any at all! Answers on a postcard for that one.
Banners Concealed
What was interesting was that the Secure Shell service doesn’t present an option to hide the banner any more, and on investigation, the majority-held community-version of this story is that the banner is needed in some cases.
Apache however did present a banner obfuscation option. For Ubuntu 18 and Apache 2.4.29, this involved:
apt install libapache2-mod-security2
a2enmod security2
edit /etc/apache2/conf-available/security.conf
ServerTokens set to “Prod”
systemctl restart apache2
This setup results in the following banner for Apache: Apache httpd – so no version number.
The outcome? As expected, all mention of Apache has now ended. Neither OpenVAS or Nessus reported anything to do with Apache of any note.
What DID The Scanners Find?
Just to summarise the findings when the banners were fully on display…it wasn’t a blank slate. There were some findings. Here are the highlights – for OpenVAS:
All Critical issues detected were related to PHPMyAdmin, plus one related to jQuery being EOL, but not stating any particular vulnerability. These version numbers are remotely queriable and this is the basis on which these issues were reported.
The SSH and Apache issues.
Other lower criticality issues were around certificate ciphers.
Some CVSS 6, medium issues with Samba – again these are banner-grabbed guesswork findings.
Nessus didn’t report anything outside of what OpenVAS flagged. OpenVAS reported significantly more issues.
It should be said that both scanners did a lot of querying for HTTP application layer issues that could be seen in the packet sniffer output. For example, queries were made for Python/Django settings.py (database password), and other HTTP gotchas.
Unauthenticated Versus Credentialed Testing
With VA Scanners, the picture hasn’t really changed in 20 years. If anything the picture is worse now because the balance with banner-grabbing guesswork has swung too far the other way, and we have to plead with the scanners to tell us about downlevel software versions. This is presumably an effort to reduce the number of false positives, but its not an advisable strategy. It’s perfectly ok to let us know we are running old wares and if we want, we should be able to see the CVEs associated with our listening services, even if many of them are false positives (and I can say from 20 years of network penetration testing, there will be plenty).
With this type of unauthenticated VA scanning though, the real problem has always been false negatives (to the extent that an open Docker API wasn’t flagged as a problem by either scanner), but none of the other commercial tools out there (I have tried a few in recent years) will be in a better position, because there is hard-limit that can be achieved non-locally with no adminstrative authentication credentials.
Both Nessus and OpenVAS allow use of credentialled based testing but its clear this aspect was never a part of the core design. Nessus has expanded its portfolio of credentialed tests but in the time allocated I could not get it to work with SSH public key authentication. In any case, a CIS benchmark approach will always be not-so-great, for reasons outside the scope of this article. We also have to be careful about where authentication credentials are stored. In the case of SSH keys, this means storing a private key, and with some vendors the key will be stored in their cloud somewhere out there.
Conclusion
This post focusses on one major aspect of VA scanning that is grabbing banners and reporting on vulnerability based on the findings from the banner. This is better than nothing but its futility is hopefully illustrated here, and this approach is core to most of what VA scanners do for us.
The market priority has always been towards unauthenticated scanning. Little focus was ever given to credentialed scanning. This has to change because the unauthenticated approach is like trying to diagnose a problem with your car without ever lifting the bonnet/hood, and moreover we could be moving into an era where accreditation bodies mandate credentialed scanning.
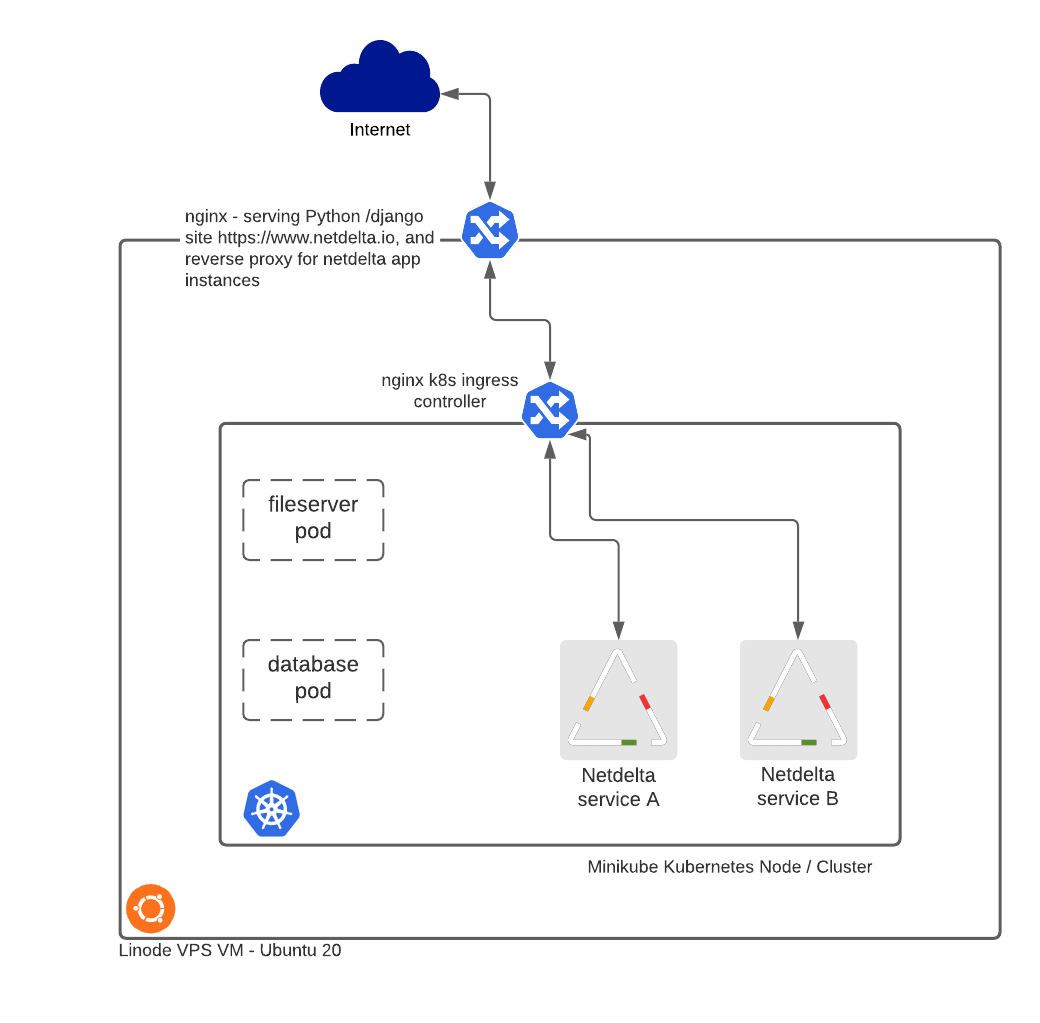
In latish 2020, I moved Netdelta from a Docker deployment to Kubernetes, partly to see what all this Kubernetes jazz is about, and partly to investigate whether it would help me with the management of Netdelta containers for different punters, each of whom has their own docker container and Apache listening service.
I studiously went through the Kubernetes quick tutorial and found i had to investigate the documentation some more. Even then some aspects weren’t covered so well. This post explains what i did to deploy an app into Kubernetes, and some of the gotchas i encountered along the way, that were not covered so well in the Kubernetes documentation, and I summarise with a view of Kubernetes and give my view on: is the hype justified? Will I continue to host Netdelta in Kubernetes?
This is not a Kubernetes tutorial – it does assume some prior exposure on behalf of the reader, but nonethless links to the relevant documentation when some Kubernetes concepts are covered.
This post isn’t about Netdelta, but for illustrative purposes: Netdelta aids with the detection of unauthorised changes, and hacker shells, by running one-off port scans, or scheduled jobs, comparing the results with the previous scan, and alerting on changes. This is more chunky than it sounds, mostly because of the analytics that goes into false positives detection. In the Kubernetes implementation, scan results are held in a stateful persistent volume with MySQL.
Netdelta’s docker config can be dug into here, but to summarise the docker setup:
The data flows aspect reflects what is not exactly a bare metal deployment. A Linode-hosted VM running Ubuntu 20 is the host, then the Kubernetes node is minikube, with another node running on a Raspberry pi 3 – the latter aspect not being a production facility. The pi 3 was only to test how well the config would work with load balancing, and Kubernetes Replicasets across nodes.
Reverse Proxy
Ingress connections from the internet are handled first by nginx acting as a reverse proxy. Base URLs for Netdelta are of the form https://www.netdelta.io/<site>. The nginx config …
This is passing a URL with a first level of <site> to be processed at local.netdelta.io, which is locally resolvable, and is localhost. This is where the nginx Kubernetes Ingress Controller comes into play. The pods in kubernetes have NodePorts configured but these aren’t necessary. The nginx ingress controller takes connections on port 80, and routes based on service names and the defined listening port:
So the nginx ingress controllers sees the connection forwarded from local.netdelta.io with a URL request of local.netdelta.io/<site>. The requests matches a rule, and forwards to the Kubernetes Service of the same name. The entity that actually answers the call is a docker container masquerading as a Kubernetes Pod, which is part of a deployment. The next step in the data flow is to route the connection to the specified Kubernetes Service which is covered briefly here but in more detail later in the coverage of DNS.
The “service” aspect has the effect of exposing the pod according to the service setup:
┌──(iantibble㉿bionic)-[~/netdd/k8s]
└─$ kubectl get services -o wide
NAME                TYPE        CLUSTER-IP       EXTERNAL-IP   PORT(S)          AGE    SELECTOR
kubernetes          ClusterIP   10.96.0.1                443/TCP          119d
mysql-netdelta      ClusterIP   10.97.140.111            3306/TCP         39d    app=mysql-netdelta
netdelta-barbican   NodePort    10.103.160.223           9004:30460/TCP   36d    app=netdelta-barbican
netdelta-xynexis    NodePort    10.102.53.156            9005:31259/TCP   36d    app
DNS
There’s an awful lot of waffle out there about DNS and Kubernetes. Basically – and I know the god of devops won’t let me in heaven for saying this, but making a service in Kubernetes leads to DNS being enabled. DNS in a multi-namespace, multi-node scenario becomes more intreresting of course, and there’s plenty you can configure that’s outside the scope of this article.
Netdelta’s Django settings.py defines a host and database name, and has to be able to find the host:
DATABASES = {
    'default': {
        'ENGINE': 'django.db.backends.mysql', # Add 'postgresql_psycopg2', 'mysql', 'sqlite3' or 'oracle'.
        'NAME': 'netdelta-SITENAME',                  # Not used with sqlite3.
        'USER': 'root', # Not used with sqlite3.
        'HOST': mysql-netdelta,
        'PASSWORD': 'NOYFB',
        'OPTIONS': dict(init_command="SET sql_mode='STRICT_TRANS_TABLES,NO_ZERO_IN_DATE,NO_ZERO_DATE,ERROR_FOR_DIVISION_BY_ZERO,NO_AUTO_CREATE_USER'"),
    }
}
This aspect was poorly documented and was far from obvious: the spec.selector field of the service should match the spec.template.metadata.labels of the pod created by the Deployment.
The Application Hosting in Kubernetes
Referring back to the diagram above, there are pods for each Netdelta site. How was the Docker-hosted version of Netdelta represented in Kubernetes?
Has the effect of creating a pod and a container for the Django application, celery and Apache stack:
┌──(iantibble㉿bionic)-[~]
└─$ kubectl get deployments
NAME                READY   UP-TO-DATE   AVAILABLE   AGE
fileserver          1/1     1            1           25d
mysql-netdelta      1/1     1            1           25d
netdelta-barbican   1/1     1            1           25d

┌──(iantibble㉿bionic)-[~]
└─$ kubectl get pods
NAME                                 READY   STATUS    RESTARTS   AGE
fileserver-6d6bc54f6c-hq8lk          1/1     Running   2          25d
mysql-netdelta-5fd7757c66-xqp2j      1/1     Running   2          25d
netdelta-barbican-68d78c58bd-vnqdn   1/1     Running   2          25d
K8s Equivakent of Docker Entrypoint Script Parameters
Some other points perhaps worthy of mention were around the Docker v Kubernetes aspects. My docker run command for the netdelta application container was like this:
So there’s 4 parameters for the entryscript: site, port, le, and cert. The last two are about letsencrypt certs which won’t be covered here. These are represented in the Kubernetes Deployment YAML in spec.template.spec.containers.args.
Private Image Repository
spec.template.spec.containers.image is set to registry.netdelta.io/netdelta/<site>:<version tag>. Yes, that’s right folks, i’m using a private registry, which is a lot of fun until you realise how hard it is to manage the images there. The setup and management of the private registry won’t be covered here but i found this to be useful.
One other point is about security and encryption in transit for the image pushes and pulls. I’ve been in security for 20 years and have lots of unrestricted penetration testing experience. It shouldn’t be necessary or mandatory to use HTTPS over HTTP in most cases. Admittedly i didn’t spend long trying, but i could not find a way to just use good old clear-text port 80 over 443, which in turn meant i had to configure a SSL certifcate with all the management around it, where the risks are far from justifying such a measure.
PV Mounts
In Dockerland I was using Docker Volumes for persistent storage of logs and application data. I was also using it for the application codebase, and any updates would be sync’d with containers by docker exec wrapped in a BASH script.
There was nothing unexpected in the deployment of the PVCs/PVs, but a couple of points are worth mentioning:
PV Filesystem mounts: Netdelta container deployment involves a custom image from COPY (Docker command) of files from a local source to the image. Then the container is run and the application can find the required files. The problem i ran into was about having filesystems mounted over the directories where my application container expected to find files. This meant i had to change my container entryscript to sync with the image when the Pod is deployed, whereas previously the directories were built-out from the docker image build.
/tmp as default PV files location: if you SSH to the node (minikube container in my case), you will find the mounted filesystems under /tmp. /tmp is a critical directory for the good health of any Linux-based system and it needs to be 777 (i.e. read and writeable by unauthenticated users and processes) with a sticky bit. This is one that for whatever reason doesn’t find its way into security checklists for Kubernetes but it really does warrant some attention. This can be changed by customising Kubernetes Storage Classes. There’s one pointer here.
Database and Fileserver
The MySQL Database service was deployed as a custom built container with my Docker setup. There was no special reason for this other than to change filesystem permissions, and the fact that the listening service needed to be “exposed” and the database config changed to bind to 0.0.0.0 instead of localhost. What i found with the Kubernetes Pod was that I didn’t need to change the Mysql config at all and spec.ports.targetport had the effect of “exposing” the listening service for the database.
The main reason for using a fileserver in the Dcoker deployment of Netdelta was to act as a container buffer between Docker Volumes and application containers. My my Unix hat on, one is left wondering how filesystem persmissions will work (or otherwise) with file read and writes across network mounted disparate unix systems, where even if the same account names exist on each system, perhaps they have different UIDs (BSD-derived systems use the UID to define ownership, not the name on the account). Moreover it was advised as a best practice measure in the Docker documentation to use an intermediate fileserver. Accordingly this was the way i decided to go with Kubernetes, with a “sidecar” Pod as a fileserver, which mounts the PVs onto the required mount points.
To K8s Or Not To K8s?
When you think about the way that e.g. Minikube is deployed – its a docker container. If you run a docker ps -a, you can see all the mechanics at work. And then if you SSH to the minikube, you can do another docker ps -a, and you see everything to do with Kubernetes pods and containers in the output. This seems like a mess, and if it isn’t, it will do until the mess actually arrives.
Furthermore, you don’t even want to look at the routing tables or network interfaces on the node host. You just cannot unsee that.
There is some considerable complexity here. Further, when you read the documentation for Kubernetes, it does have all the air of documentation written by programmers. We hear a lot about the lack of IT-skilled people, but what is even more lacking, are strategic thinkers (e.g. * [wildcard] Architects) who translate top level business design requirements into programming tactical requirements.
Knowing how Kubernetes works should be enough to know whether it’s really going to be beneficial or not to host your containers there. If you’re not sure you need it, then you probably don’t. In the case of Netdelta, if i have lots and lots of Netdelta sites to manage then i can go with Kubernetes, and now that i have seen Netdelta happily running in Kubernetes with both scheduled celery jobs and manual user-initiated scans, the transition will be a smooth one. In the meantime, I can work with Docker containers alone, with the supporting BASH scripts, whuch are here if you’re interested.
Part Five – Cryptography and Key Management, and Identity Management
Part Six – Trust (network controls, such as firewalls and proxies), and Resilience
Logging
Notice “Logging” is used here, not “SIEM”. With use of “SIEM”, there is often a mental leap, or stumble, towards a commercial solution. But there doesn’t necessarily need to be a commercial solution. This post invites the reader to take a step back from the precipice of engaging with vendors, and check first if that journey is one you want to make.
Unfortunately, in 2020, it is still the case that many fintechs are doing one of two things:
Procuring a commercial solution without thinking about what is going to be logged, or thinking about the actual business goals that a logging solution is intended to achieve.
Just going with the Cloud Service Provider’s (CSP) SaaS offering – e.g. Stackdriver (now called “Operations”) for Google Cloud, or Security Center for Azure.
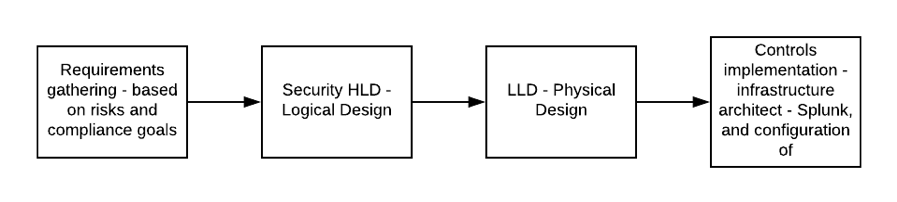
Design Process
The process HLD takes into risks from threat modelling (and maybe other sources), and another input from compliance requirements (maybe security standards and legal requirements), and uses the requirements from the HLD to drive the LLD. The LLD will call out the use cases and volume requirements that satisfy the HLD requirements – but importantly, it does not cover the technological solution. That comes later.
The diagram above calls out Splunk but of course it doesn’t have to be Splunk.
Security Operations
The end goal of the design process is heavily weighted towards a security operations or protective monitoring capability. Alerts will be specified which will then be configured into the technological solution (if it supports this). Run-books are developed based on on-going continuous improvement – this “tuning” is based on adjusting to false positives mainly, and adding further alerts, or modifying existing alerts.
The decision making on how to respond to alerts requires intimate knowledge of networks and applications, trust relationships, data flows, and the business criticality of information assets. This is not a role for fresh graduates. Risk assessment drives the response to an alert, and the decision on whether or not to engage an incident response process.
General IT monitoring can form the first level response, and then Security Operations consumes events from this first level that are related to potential security incidents.
Two main points relating this SecOps function:
Outsourcing doesn’t typically work when it comes to the 2nd level. Outsourcing of the first level is more likely to be cost effective. Dr Anton Chuvakin’s post on what can, and cannot be outsourced in security is the most well-rounded and realistic that i’ve seen. Generally anything that requires in-house knowledge and intimacy of how events relate to business risks – this cannot be outsourced at all effectively.
The maturity of SecOps doesn’t happen overnight. Expect it to take more than 12 months for a larger fintech with a complex cloud footprint.
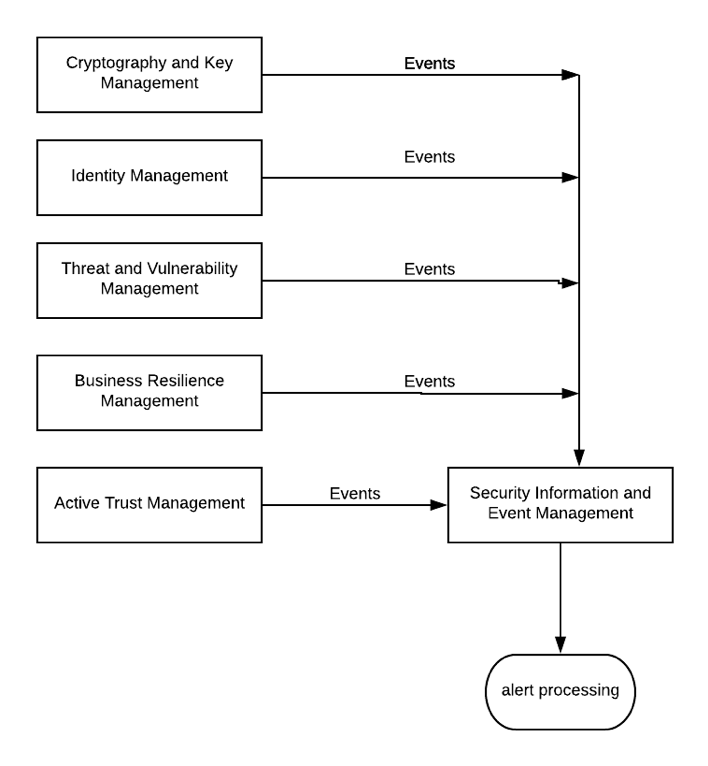
The logging capability is the bedrock of SecOps, and how it relates to other security capabilities can be simplified as in the diagram below. The boxes on the left are self-explanatory with the possible exception of Active Trust Management – this is heavily network-oriented and at the engineering end of the rainbow, its about firewalls, reverse and forward proxies mainly:
Custom Use Cases
For the vast majority of cases, custom use cases will need to be formulated. This involves building a picture of “normal”, so as to enable alerting on abnormal. So taking the networking example: what are my data flows? Take my most critical applications – what are source and destination IP addresses, and what is the port on the server-side of the client-server relationship? So then a possible custom use case could be: raise an alert when a connection is aimed at the server from anywhere other than the client(s).
Generic use cases are no-brainers. Examples are brute force attempts and technology or user behaviour-specific use cases. Some good examples are here. Custom use cases requires an understanding of how applications, networks, and operating systems are knitted together. But both custom and generic use cases require a log source to be called out. For network events, this will be a firewall as the best candidate. It generally makes very little sense to deploy network IDS nodes in cloud.
So for each application, generate a table of custom use cases, and identify a log source for each. Generic use cases are those configured auto-tragically in Splunk Enterprise Security for example. But even Splunk cannot magically give you custom use cases, or even ensure that all devices are included in the coverage for generic use cases. No – humans still have a monopoly over custom use cases and well, really, most of SIEM configuration. AI and Cyberdyne Systems won’t be able to get near custom use cases in our lifetimes, or ever, other than the fantasy world of vendor Powerpoint slides.
Don’t forget to test custom use case alerting. So for network events, spin up a VM in a centrally trusted area, like a management Vnet/VPC for example. Port scan from there to see if alerts are triggered. Netcat can be very useful here too, for spoofing source addresses for example.
Correlation
Correlation was the phrase used by vendors in the heady days of the 00s. The premise was something like this: event A, event B, and event C. Taken in isolation (topical), each seem innocuous. But bake them together and you have a clear indicator that skullduggery is afoot.
I suggest you park correlation in the early stage of a logging capability deployment. Maybe consider it for down the road, once a decent level of maturity has been reached in SecOps, and consider also that any attempt to try and get too clever can result in your SIEM frying circuit boards. The aim initially should be to reduce complexity as much as possible, and nothing is better at adding complexity than correlation. Really – basic alerting on generic and custom use cases gives you most of the coverage you need for now, and in any case, you can’t expect to get anywhere near an ideal state with logging.
SaaS
Operating system logs are important in many cases. When you decide to SaaS a solution, note that you lose control over operating system events. You cannot turn off events that you’re not interested in (e.g. Windows Object auditing events which have had a few too many pizzas). This can be a problem if you decide to go with a COTS where licensing costs are based on volume of events. Also, you cannot turn on OS events that you could be interested in. The way CSPs play here is to assume everything is interesting, which can get expensive. Very expensive.
Note – its also, in most cases, not such a great idea to use a SaaS based SIEM. Why? Because this function has connectivity with everything. It has trust relationships with dev/test, pre-prod, and production. You really want full control over this platform (i.e. be able to login with admin credentials and take control of the OS), especially as it hosts lots of information that would be very interesting for attackers, and is potentially the main target for attackers, because of the trust relationships I mentioned before.
So with SaaS, its probably not the case that you are missing critical events. You just get flooded. The same applies to 3rd party applications, but for custom, in-house developed applications, you still have control of course of the application layer.
Custom, In-house Developed Applications
You have your debugging stream and you have your application stream. You can assign critical levels to events in your code (these are the classic syslog severity levels). The application events stream is critical. From an application security perspective, many events are not immediately intuitively of interest, but by using knowledge of how hackers work in practice, security can offer some surprises here, pleasant or otherwise.
If you’re a developer, you can ease the strain on your infosec colleagues by using consistent JSON logging keys across the board. For example, don’t start with ‘userid’ and then flip to ‘user_id’ later, because it makes the configuration of alerting more of a challenge than it needs to be. To some extent, this is unavoidable, because different vendors use different keys, but every bit helps. Note also that if search patterns for alerting have to cater for multiple different keys in JSON documents, the load on the SIEM will be unnecessarily high.
It goes without saying also: think about where your application and debug logs are being transmitted and stored. These are a source of extremely valuable intelligence for an attacker.
The Technology
The technological side of the logging capability isn’t the biggest side. The technology is there to fulfil a logging requirement, it is not in itself the logging capability. There are also people and processes around logging, but its worth talking about the technology.
What’s more common than many would think – organisation acquires a COTS SIEM tool but the security engineers hate it. Its slow and doesn’t do much of any use. So they find their own way of aggregating network-centralised events with a syslog bucket of some description. Performance is very often the reason why engineers will be grep’ing over syslog text files.
Whereas the aforementioned sounds ineffective, sadly its more effective than botched SIEM deployments with poorly designed tech. It also ticks the “network centralised logging” box for auditors.
The open-source tools solution can work for lots of organisations, but what you don’t get so easily is the real-time alerting. The main cost will be storage. No license fees. Just take a step back, and think what it is you really want to achieve in logging (see the design process above). The features of the open source logging solution can be something like this:
Rsyslog is TCP and covers authentication of hosts. Rsyslog is a popular protocol because it enables TCP layer transmission from most log source types (one exception is some Cisco network devices and firewalls), and also encryption of data in transit, which is strongly recommended in a wide open, “flat” network architecture where eavesdropping is a prevalent risk.
Even Windows can “speak” rsyslog with the aid of a local agent such as nxlog.
There are plenty of Host-based Intrusion Detection System (HIDS) agents for Linux and Windows – OSSEC, Suricata, etc.
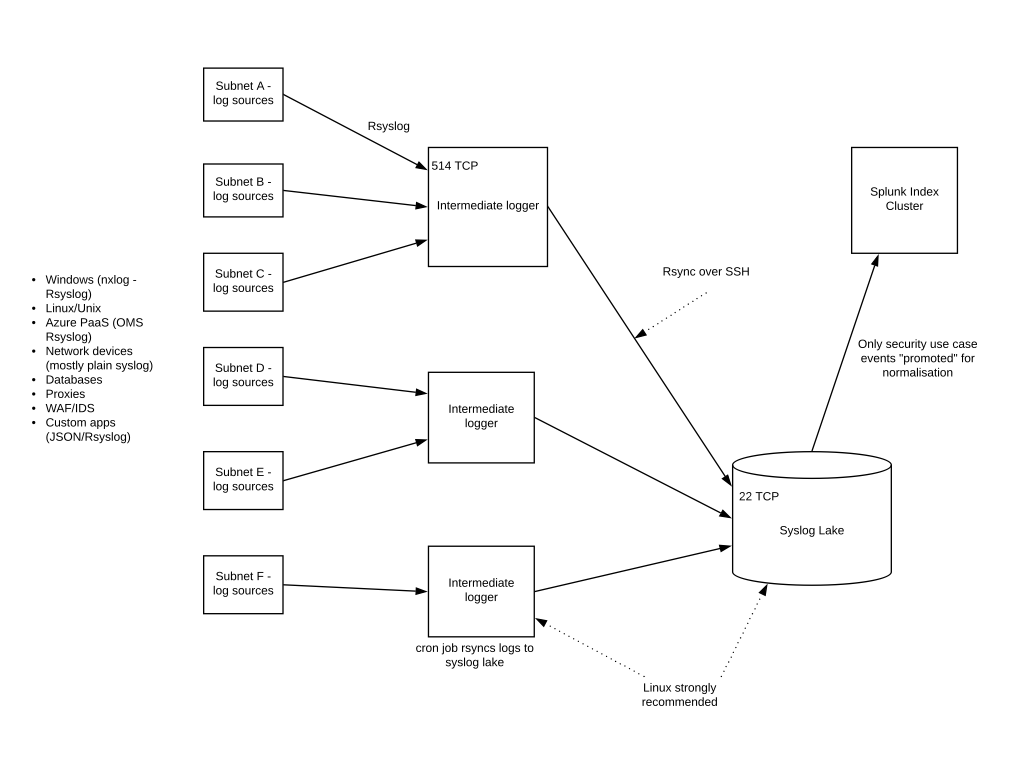
Intermediate network logging Rsyslog servers can aggregate logs for network zones/subnets. There are the equivalent of Splunk forwarders or Alienvault Sensors. A cron job runs an rsync over Secure Shell (SSH), which uploads the batches of events data periodically to a Syslog Lake, for want of a better phrase.
The folder structure on the Syslog server can reflect dates – years, months, days – and distinct files are named to indicate the log source or intermediate server.
Splunk sales people have a dart board with my picture on it. To be fair, the official Splunk line is that they want to help their customers save events indexing money because it benefits them in the longer term. And they’re right, this does work for Splunk and their customers. But many of the resellers are either lacking the skills to help, or they are just interested in a quick and dirty install. “Live for today, don’t worry about tomorrow”.
Splunk really is a Lamborghini, and the few times when i’ve been involved in bidding beauty parades for SIEM, Splunk often comes out cheaper believe it or not. Splunk was made for logging and was engineered as such. Some of the other SIEM engines are poorly coded and connect to a MySQL database for example, whereas Splunk has its own database effectively. The difference in performance is extraordinary. A Splunk search involving a complex regex with busy indexers and search heads takes a fraction of the time to complete, compared with a similar scenario from other tools on the same hardware.
Three main ways to reduce events indexing costs with Splunk:
Root out useless events. Windows is the main culprit here, in particular Auditing of Objects. Do you need, for example, all that performance monitoring data? Debug events? Firewall AND NIDS events? Denied AND accepted packets from firewalls?
You can be highly selective about which events are forwarded to the Splunk indexer. One conceptual model just to illustrate the point is given below:
Threat Hunting
Threat Hunting is kind of the sexy offering for the world of defence. Offence has had more than its fair share of glamour offerings over the years. Now its defence’s turn. Or is it? I mean i get it. It’s a good thing to put on your profile, and in some cases there are dramatic lines such as “be the hunter or the hunted”.
However, a rational view of “hunting” is that it requires LOTS of resources and LOTS of skill – two commodities that are very scarce. Threat hunting in most cases is the worst kind of resources sink hole. If you take vulnerability management (TVM) and the kind of basic detection discussed thus far in this article, you have a defence capability that in most cases fits the risk management needs of the organisation. So then there’s two questions to ask:
How much does threat hunting offer on top of a suitably configured logging and TVM capability? Not much in the best of cases. Especially with credentialed scanning with TVM – there is very little of your attack surface that you cannot cover.
How much does threat hunting offer in isolation (i.e. threat hunting with no TVM or logging)? This is the worst case scenario that will end up getting us all fired in security. Don’t do it!!! Just don’t. You will be wide open to attack. This is similar to a TVM program that consists only of one-week penetration tests every 6 months.
Threat Intelligence (TI)
Ok so here’s a funny story. At a trading house client here in London around 2016: they were paying a large yellow vendor lots of fazools every month for “threat intelligence”. I couldn’t help but notice a similarity in the output displayed in the portal as compared with what i had seen from the client’s Alienvault. There is a good reason for this: it WAS Alienvault. The feeds were coming from switches and firewalls inside the client network, and clearly $VENDOR was using Alienvault also. So they were paying heaps to see a duplication of the data they already had in their own Alienvault.
The aforementioned is an extremely bad case of course. The worst of the worst. But can you expect more value from other threat intelligence feeds? Well…remember what i was saying about the value of an effective TVM and detection program? Ok I’ll summarise the two main problems with TI:
You can really achieve LOTS in defence with a good credentialed TVM program plus even a half-decent logging program. I speak as someone who has lots of experience in unrestricted penetration testing – believe me you are well covered with a good TVM and detection SecOps function. You don’t need to be looking at threats apart from a few caveats…see later.
TI from commercial feeds isn’t about your network. Its about the whole planet. Its like picking up a newspaper to find out what’s happening in the world, and seeing on the front cover that a butterfly in China has flapped its wings recently.
Where TI can be useful – macro developments and sector-specific developments. For example, a new approach to Phishing, or a new class of vulnerability with software that you host, or if you’re in the public sector and your friendly national spy agency has picked up on hostile intentions towards you. But i don’t want to know that a new malware payload has been doing the rounds. In the time taken to read the briefing, 2000 new payloads have been released to the wild.
Summary
Start out with a design process that takes input feeds from compliance and risk (perhaps threat modelling), use the resulting requirements to drive the LLD, which may or may not result in a decision to procure tech that meets the requirements of the LLD.
An effective logging capability can only be designed with intimate knowledge of the estate – databases, crown jewels, data flows – for each application. Without such knowledge, it isn’t possible to build even a barely useful logging capability. Call out your generic and custom use cases in your LLD, independent of technology.
Get your basic alerting first, correlation can come later, if ever.
Outsourcing is a waste of resources for second level SecOps.
With SaaS, your SIEM itself is dangerously exposed, and you have no control over what is logged from SaaS log sources.
You are not mandated to get a COTS. Think about what it is that you want to achieve. It could be that open source tools across the board work for you.
Splunk really is the Lamborghini of SIEMs and the “expensive” tag is unjustified. If you carefully design custom and generic use cases, and remove everything else from indexing, you suddenly don’t have such an expensive logger. You can also aggregate everything in a Syslog pool before it hits Splunk indexers, and be more selective about what gets forwarded.
I speak as someone with lots of experience in unrestricted penetration testing: Threat Hunting and Threat Intelligence aren’t worth the effort in most cases.
Netdelta
Regular port scans - alert on changes in networks and/or hosted services
If your network perimeter changes unexpectedly, that's probably bad! Unauthorised change? Steve in networking misconfigured a firewall? Hacker's shell? Shadow IT? Rogue device? Post-M&A networking headaches?
My book on the state / plight of the security industry and its customers was published in December 2011. As a play on the title of Ross Anderson's venerable book, Security De-engineering covers how the security industry was De-engineered over the past decade or so for the detriment of all, and I give a potential solution to our woes.


 This can be a problem if you decide to go with a COTS where licensing costs are based on volume of events. Also, you cannot turn on OS events that you could be interested in. The way CSPs play here is to assume everything is interesting, which can get expensive. Very expensive.